AWS Lambda has this nice graph on the monitor page for an indivdiaul lambda function that shows its success rate.
Recently I had a lambda that was broken due to a failed build during a terraform apply. Terraform applied fine, but the lambda build didn’t include the right dependencies. The result: 100% error rate over… well, over a very long time. I didn’t catch it because there was no alerts or monitoring that surfaced it.
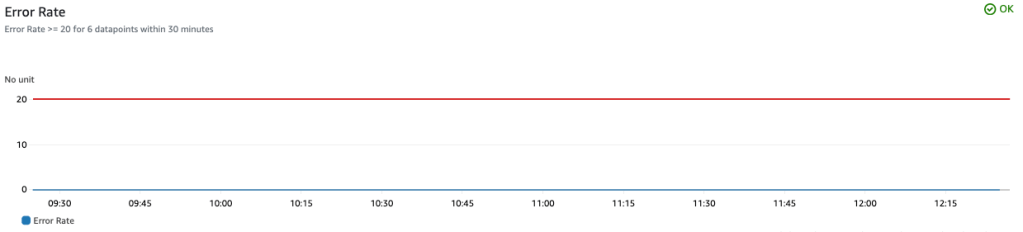
The success rate metric above is not something that’s actually available in cloud watch, instead it’s computed via SUM(invocation) - SUM(errors) / SUM(invocations). I wondered if I could use metric math to alarm on a high error rate: SUM(errors) / SUM(invocations).
locals {
  error_rate_threshold = 20
  metric_dimensions = {
    FunctionName = aws_lambda_function.this.function_name,
  }
}

resource "aws_lambda_function" "this" {
  # ...
}

resource "aws_sns_topic" "alarms" {
  # ...
}

resource "aws_cloudwatch_metric_alarm" "example" {
  alarm_name          = "${aws_lambda_function.this.function_name}-high-error-rate"
  comparison_operator = "GreaterThanOrEqualToThreshold"
  evaluation_periods  = 6
  threshold           = local.error_rate_threshold
  alarm_description   = "${local.error_rate_threshold}% error rate over the last 30 minutes"

  metric_query {
    id          = "error_rate"
    expression  = "IF(invocations > 0, errors / invocations, 0)"
    label       = "Error Rate"
    return_data = true
  }

  metric_query {
    id = "invocations"

    metric {
      metric_name = "Invocations"
      namespace   = "AWS/Lambda"
      period      = 300
      stat        = "Sum"
      unit        = "Count"
      dimensions  = local.metric_dimensions
    }
  }

  metric_query {
    id = "errors"

    metric {
      metric_name = "Errors"
      namespace   = "AWS/Lambda"
      period      = 300
      stat        = "Sum"
      unit        = "Count"
      dimensions  = local.metric_dimensions
    }
  }

  alarm_actions = [
    aws_sns_topic.alarms.arn,
  ]
  ok_actions    = [
    aws_sns_topic.alarms.arn,
  ]
}
Let’s work from the outside in:
metric_query {
  id          = "error_rate"
  expression  = "IF(invocations > 0, errors / invocations, 0)"
  label       = "Error Rate"
  return_data = true
}
The above is the actual metric that’s tracked. return_data is the key bit here as that tells cloudwatch that this computed metric is what the alarm is tracking. From the API reference docs:
When used in
PutMetricAlarm, specifytruefor the one expression result to use as the alarm. For all other metrics and expressions in the samePutMetricAlarmoperation, specifyReturnDataas False
Note the IF condition to make sure there’s no dividing by zero.
metric_query {
  id = "invocations"

  metric {
    metric_name = "Invocations"
    namespace   = "AWS/Lambda"
    period      = 300
    stat        = "Sum"
    unit        = "Count"
    dimensions  = local.metric_dimensions
  }
}

metric_query {
  id = "errors"

  metric {
    metric_name = "Errors"
    namespace   = "AWS/Lambda"
    period      = 300
    stat        = "Sum"
    unit        = "Count"
    dimensions  = local.metric_dimensions
  }
}
These two bits are summing invocations and errors over a 5 minute period. Note the id in each of them: this id is used in the return_data metric query above: IF(invocations > 0, errors / invocations, 0).
We packaged this up as part of the terraform module we use for all of our lambdas and setting an error_rate_threshold to something > zero will enable it.