At PMG, we’ve spent the last few months instrumenting our applications with OpenTelemetry and integrating with a tracing vendor. Part of this, for me, was reading the Observability Engineering book, learning about service level objectives from it, and then reading a SLO book as well.
SLOs are very exciting to me, actual relevant alerts based on bad user experience? Yes, please.
So I’ve been taking a pass at defining some for services I’m responsible for. One of thoes is Alli Central, our repository of client information and authn/authz. I came up with one SLO based on P99 latency, which is, frankly, pretty awful. I set a threshold for <2 seconds average P99 latency from the load balancer and was pretty regularly breaching it.
My hunch — my observability 1.0 thinking — was that token validation and issuance was taking too long. I was wrong. Looking at traces, the slowest endpoint was for dispatching notifications, not tokens — some taking as long at 7-9 seconds to respond.
Digging into the traces, they all look like this:
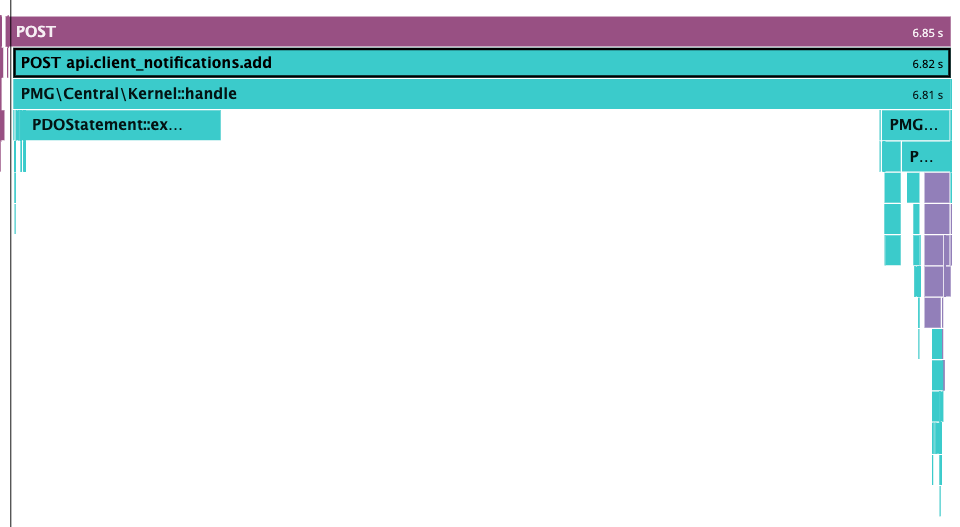
There is a pretty slow query (2 seconds in the example above) to the left, then a large gap during which deserialization and validation occurs, then the rest of the work.
Turned out the problematic bit was that query which was often slow, but always returned ~2,100 rows in the production environment. This was then read into memory and manipulataed a bit to do some validation work for an enum-ish API field.
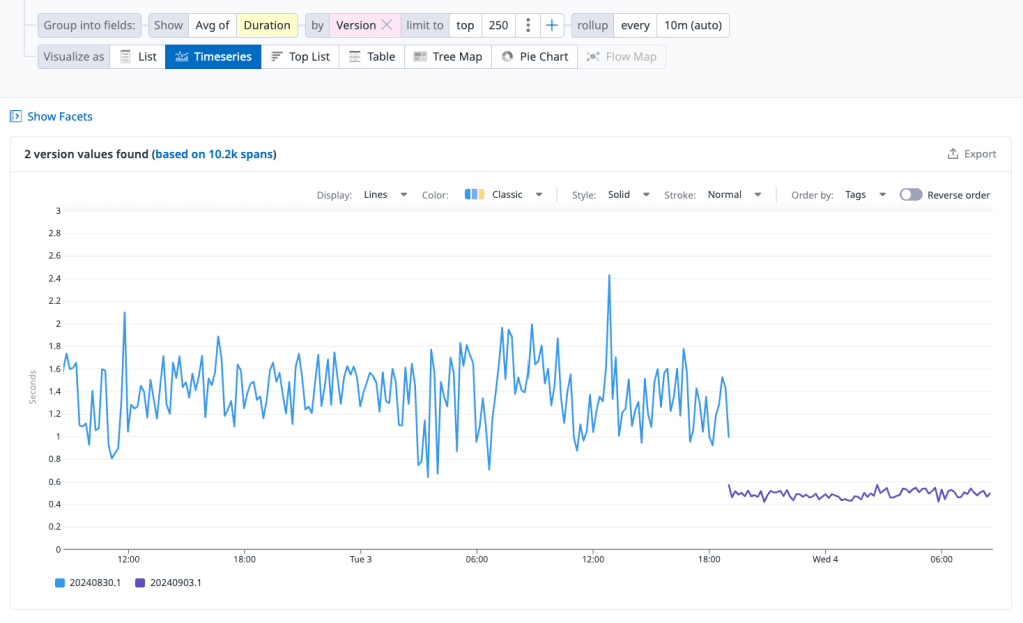
This is all fine on the pre-prod environment and in tests because the data set was so much smaller. And frankly it was probably fine on production but got steadily worse as the data set grew. A small change to that validation logic later and the endpoint is behaving much better on average.
Observability 2.0 Thinking
This is something I’m bad at. I’ve been at PMG a long time. I know our systems really well because I built a lot of them and have at least tounched most of them. Often instead of being data driven, I go down rabbit holes based on my hunches on performance.
This was a nice change of pace: I saw a SLO error budget burning down quickly, wondered why, then started by exploration by looking at, “what are the slowest things for the last few days?” Leading to one of the traces above, then dug into the particular endpoint to find a likely cause.
Our tracing isn’t great yet, better instrumentation in our libraries could have shown exactly where the bottleneck was without me having to fill in the gaps with my knowledge of the system — that’s some follow up work that came out of this.
O11y 2.0 thinking starts with a question and curiousity, not a hunch. Tracing lets you peak inside the app and figure out the direction of inquiry.
